
The cost of my current
This will shock no one given my lifestyle data obsession and current work focus, but I am now monitoring our home energy usage (and cost) in real time.
Back in April I noted in a harmless tweet what seemed to be far more attention to home power monitoring solutions in the UK than in the US. This prompted my excellent colleagues at IBM Hursley to try to help me out. The geeks at Hursley had for a while been playing around with the data outputs of monitoring hardware made by Current Cost. They saw my tweet, knew that Current Cost had modified some of their gizmos for US usage, and arranged to send me one.
I have bad luck with electrical home projects and I feared this one quite a lot given that I’d have to fuss with the house mains, but the installation proved remarkably easy. True, there are (as yet) no US-specific FAQs or video tutorials, but the idea was straightforward: find the mains and put the clamps over them.
In most of the UK this means locating the circuit breaker/meter combo which is located outside the house. In the US, only the meter is outside the home (due to the outdated practice of having electrical company employees drop by to read it). Yet, that’s where I started. And almost ended. The meter is sheathed in metal for obvious reasons and there didn’t seem to be any easy way in without a blowtorch. Live wires I figured I could handle; molten metal and live wires, no.
So back inside to dismantle the circuit breaker. And there they were. Three big cables: two mains, plus a ground (at the very top of the photo).
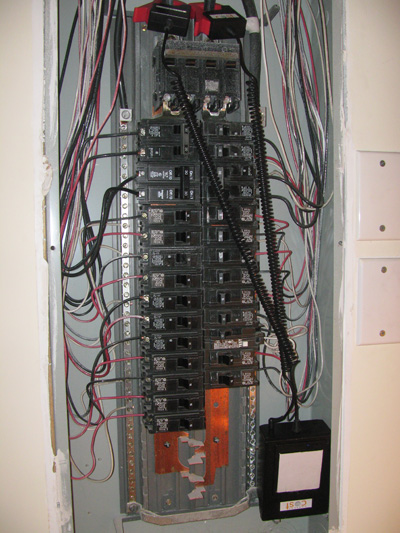
You don’t mess with wiring at all, actually. Just gently place the clamps right on the insulated lines. The clamps lead to a battery-powered transmitter box. I bolted the breaker back up and that was that. Once I plugged in the receiver I was immediately receiving real-time data and cost for electricity usage.
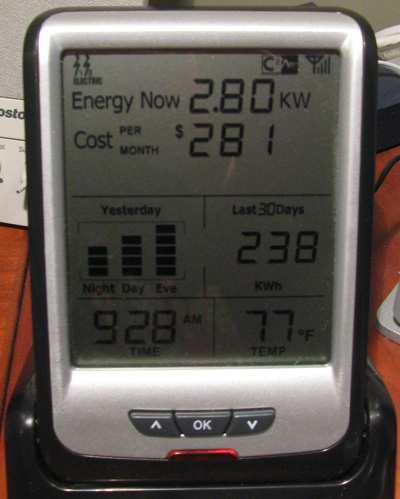
In the image above you see that the display shows two power feeds (one per main) in the upper left and that it has a firm connection to the transmitter (upper right). You always have a current energy usage readout (2.8KW). The cost cycles between at-the-moment and per month. The display is rounded out with historical data, time, and temp. (Here’s an annotated version.)
At a glance the data seems dead-on compared to our monthly electricity bills. And it is true that the current usage/cost changes merely by switching lights off and on around the house. It is definitely real-time. But the real value of the system comes in the ability to hook the monitor to your computer. Once that link is established there’s a whole set of services you can plug into.
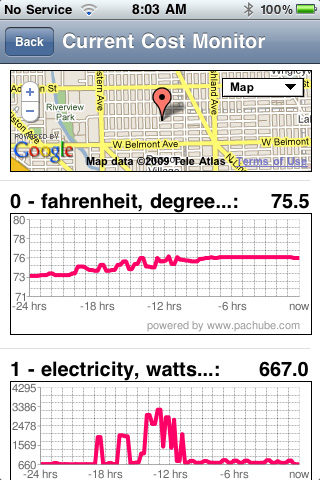
I use the Current Cost to Pachube app to send my data to the feed aggregator/visualizer service Pachube. Once there you can view the three data feeds — temperature and wattage for the two mains — over time. (The y axis is power in kilowatts.)
The week after I installed the unit we took a bit of a vacation so we were afforded the experiment of observing the house while we were not living in it. Obviously usage was way down (especially since we essentially shut off the AC), but the very quietness of the electricity usage surfaced interesting patterns in home energy consumption unprompted by human need. The graphs were mostly flatlines with regular, periodic low plateaus — obviously something was kicking in on a regular interval. We’re pretty sure one of these is the refrigerator/ice-maker, but there’s one on the other main that we’ve not been able to sleuth just yet. Has to be something with a motor, we think.
We asked our housekeeper to come while we were out — and of course knew precisely when she was there because the graph spiked (vacuum cleaner!). But the next day the graph spiked at roughly the same time and in the same way. Turns out she left early the first day and came back to finish the second (since we weren’t there). So there it is: personal energy monitoring can also help you nab squatters and spy on your home help.
Because Pachube is really a service for mixing various sets of data (ala ManyEyes) you can nearly instantly see your home’s energy usage plotted as CO2 output. And there’s a great iPhone app for viewing your Pachube feeds.
So there are two reasons to care about any of this and both relate to increasing awareness of one’s own consumption patterns (something I wrote about extensively after my stint in Africa). First is cost savings. When you have in-your-face evidence of the impact of turning down the AC or switching off the lights, you are more inclined to do it. (To say nothing of using the monitor to track down energy sucks you didn’t know you had.)
Second is that the idea of instrumenting part of one’s consumption opens up all kinds of possibilities for how we might as a planet solve larger problems. Few would argue that we need smarter power grids. Bills that reflected actual usage (rather than estimated or aggregate) would prompt even great attention to personal usage. Widespread adoption of home monitoring like Current Cost — and the sharing of anonymous data — would show utilities and local governments patterns of usage that could inform smarter maintenance, more flexible infrastructure build-out, and even “competitive” incentive programs between localities.
Last year I used WattzOn to calculate a rough personal footprint. It was atrocious. Sure I commute to work by public transportation or bike, but my international air travel shoved my impact off the charts. This year my travel is very different — lots of small trips, none international. So I recalculated my CO2 and, no surprise, housing is the number one contributor. (And that’s just the house and the power/materials it uses. The Stuff category in the chart below largely deals with our home’s appliances.)
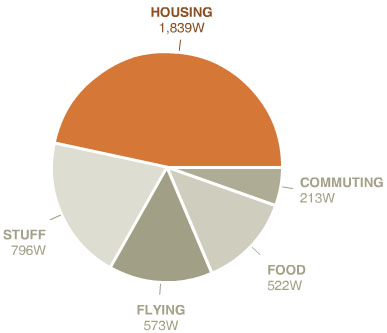
My goal is modest. I’ve like to bring the combined housing and stuff number down by 25% in twelve months. Not sure if that’s possible with the three kids, but they do like the idea of real-time feedback for their actions (rather than, say, a parent praising them merely for turning off the lights in their rooms).
In the end, beyond the sheer nerd factor of monitoring your own energy, what good is it if you don’t use the new information to effect change?
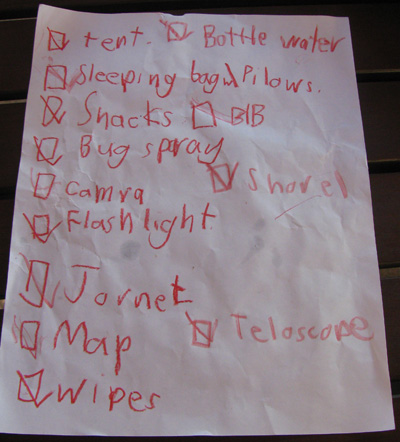
How to enjoy a night in the wilderness, in 7 easy steps
(1) Create a packing list
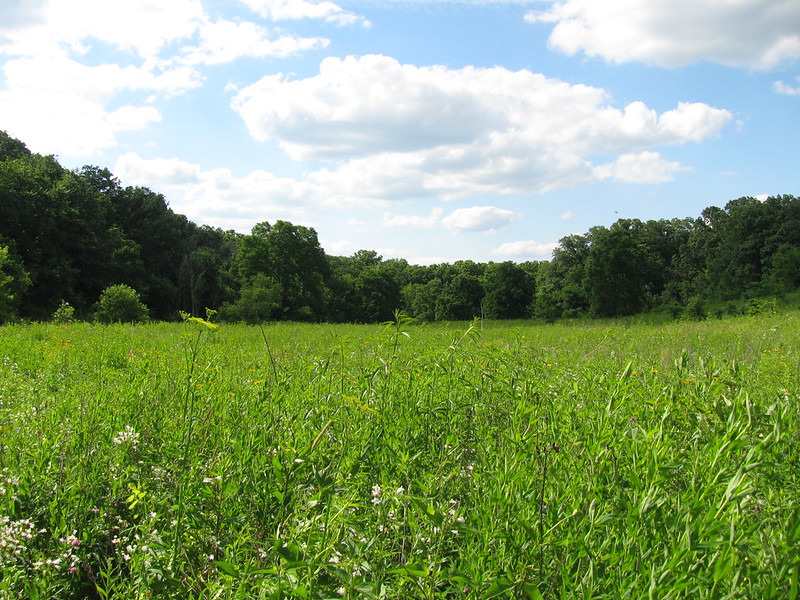
(2) Pick a scenic spot
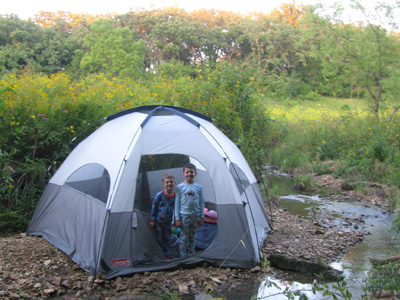
(3) Set up tent before nightfall (and hope the waters don’t rise)
(4) Listen to the nighttime bestiary come alive and supplement with scary stories

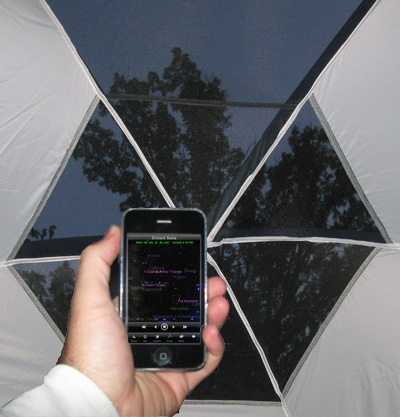
(5) Lay down, look up, and let your handheld astronomy app tell you what you’re observing
(6) Sleep well, wake up in the mist
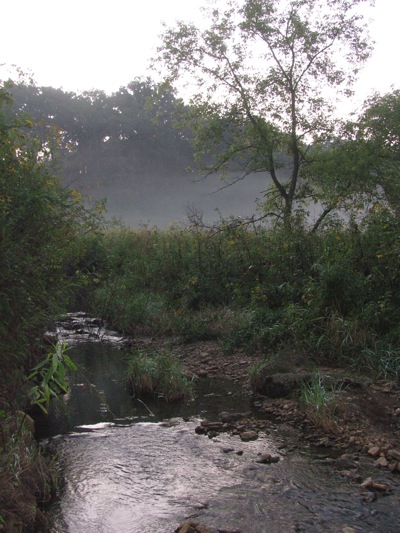
(7) Celebrate!

The city is a platform
But it needs your vote.
In what is becoming an annual ritual here, I’d like to ask for the support of Ascent Stage readers in nominating my panel for inclusion at this year’s South by Southwest Interactive conference/fest-a-go-go next year.
Here’s the quick version.
Cities abound in data generated by their inhabitants (virtual worlds, city websites) and created automatically by systems or monitoring. How does this online manifestation of the city interact in tangible ways with urban design and informal urban constructs? Is there such a thing as “the street as platform”?
I have a bunch of panelists in mind, including Andrew Huff of Gapers Block, Dan O’Neill from Everyblock (today of MSNBC!), and some urban design peeps, but we’ll wait to finalize if we get accepted.
The panel-picking site is live and if you’d just scoot over to it, weigh the merits of it against all the other nominees, forget about my past indiscretions and any slights I’ve made against you and your family, then vote for it that’d be great.
Wait, you say you already voted for this a year ago? Well, you may have and if you did, thank you, because this panel was submitted last year — and it was accepted! But so was another proposal I sent in and the organizers deemed the other one better. (I disagreed, thought it turned out OK.) So, if you wouldn’t mind, let’s try to go two for two.
And yes, folks, this is the first hint I’ve dropped on this blog about the newest project I’m working on. More soon!
Put a fork in it
A phenomenal weekend that began with beermakin’ and a crawfish boil concluded today with the merger of several of my favorite things: an outing with my wife (my birthday gift from her) on bike through the neighborhoods of Chicago in search of unique home-grown food fare.
We were part of the new Fork and the Road culinary bike tour of Unsung Chicago Classics. Our group was 13 with two knowledgeable, friendly guides and, though the weather was chafetastically hot, it was a splendid time.
First stop after departing the Loop was Maxwell Street Market and a “brunch” of huaraches, pineapple (!) tamales, and tacos al pastor, including a wonderful taco of beef tongue.

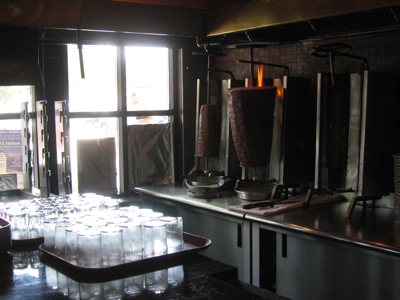
From Market Street we headed just up and over to Greektown to savor lamb and saganaki at The Parthenon where, we were told, the traditional of lighting it on fire, dousing it with lemon juice, and yelling “opaa!” originated. The Parthenon apparently is one of the few Greek restaurants that still builds their gyro cones on the vertical spit in-house. Tasty and ambient (and worth it for the air conditioning), but the best part was yet to come.
We zagged and zigged through the West Loop to Humboldt Park to our final stop at Borinquen Restaurant, originator of the Jibarito “sandwich”. The Jibarito was the best discovery of the trip: steak, lettuce, tomato, and garlic mayo smooshed between plantains. Total delight.

The group was headed back to the Loop whence we began, but thelovelywife and I were so close to home we peeled off. Not a minute after heading out we heard the chimes of an ice cream truck and, given that it was nearly 100° out, we stopped for dessert.
Nearly home, biking up Western, I heard a nasty thwack!, looked back, and found a screw had pierced my tire and exited the other side. We walked the final mile home, sweaty and full.
It’s simply a great thing, exploring the city by bike while indulging in its unique foods, but note even on a hot day and with several miles of pedaling the experience is still, as we were told, “calorie positive”. And absolutely worth it.
Full photoset here.
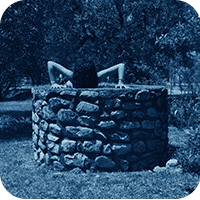
Kid in a treehouse
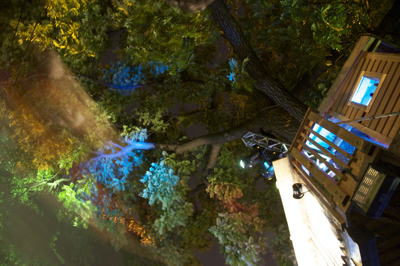
This past weekend was our annual neighborhood party, Retro on Roscoe. It’s a all-out fest that ignites the blocks around it for 48 hours. As such, some friends of ours host an annual pre-party that spans all five of their contiguous backyards — something you don’t often see in the city.
I was asked to DJ the party whose theme this year was “Boogie Nights”, basically 70’s tunes infused with other tracks that carry forward the ethos from that era. The booth was a treehouse smack in the middle of the party which we outfitted tip-to-tail with music and lighting gear. I played from 8pm to 3am and, though I almost wet myself (with no backup until late), it was an astounding event.
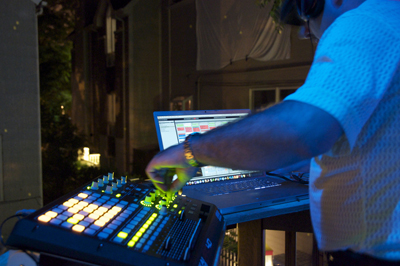
I had a stripped-down setup (compared to, say, Christmas Party), but it was ample. Just the Macbook Pro running Ableton Live, a Native Instruments Audio Kontrol multichannel interface, and an Akai APC40 control surface. The Akai was perfect, a monome-esque grid with the knobs and sliders of a Novation SL Remote — though far sturdier.
I had hundreds of song fragments pre-loaded and warped — something that gave me almost unlimited flexibility to respond to the crowd without letting things drop. I even entertained requests from those brave enough to scale the nearly vertical steps.

I didn’t want to come down. Why? Let’s recap. I was in a kickass treehouse with another geek (Tom, on lights), a good friend, and a cooler of beer. We were controlling several hundred watts of music and commanding the best view of the space. Sure, we were one chain link’s failure away from death by falling steel, but if that’s how I was supposed to go, I wouldn’t complain.
A few have asked for a recording from the night. I’m still cleaning up most of it, but here’s an excerpt from when I think the most people were out in the yard dancing. (Specifically the slightly sped-up Diana Ross with a few claps and bloops layered on top was the pinnacle, if memory serves.)
[Download the DJ set. Full photoset here.
PS – I’m two-for-two luring Chicago’s finest with low frequencies. I suppose next Christmas we’ll go for the hat trick.
Mission Elapsed Time: 20:00:21:06:42:40

I went back through it this blog (and my Flickr account) on its 20th anniversary, retracing digital footprints made on what feels like a different planet. Here are some highlights.
The Terror Tourist
A roughly monthly exploration of places in horror fiction — real or imagined, geographical or psychological — culled from The Heavy Leather Horror Show.
Subscribe to the podcast or the email newsletter or just read through the archives posted here.
The Ampcamper

How I hauled myself, two teens, an 80 lb dog, and a whole load of crap 4000+ miles across six states in twenty days using an electric vehicle. And survived to tell the tale.


